Your warehouse is out of a bearing that three customers ordered this week, and two aisles over it carries more gasket kits than their costs justify, week after week. Both came from one planning run. It gave each item one forecast number plus the same 10% cushion, whether the item loses a sale when it runs short or loses cash while it sits unsold on a shelf.
An industry research estimate, reported in August 2026 in the trade press, puts inventory distortion, out-of-stocks plus overstocks, at around $1.7tn for global retail in 2026, equal to 6.2% of worldwide sales; out-of-stocks make up 65.6% and overstocks 34.4%. Manufacturers hold heavy stock too: in the US Census Bureau's release for August 2026, US manufacturers held $1.48 of inventory per dollar of monthly sales, and US businesses about $2.8tn in all.

Short and over at the same time
When the forecast is a middle estimate, demand comes in above it about as often as below it. Stock exactly that amount and you run short in roughly half the weeks. So your planners add safety stock, usually one rule for a whole category, such as 10% on top of the forecast.
That rule adds the same cushion to an item where a shortage loses a $40 margin per unit, and to one where a spare unit costs more to hold than it ever earns. The first stays short, the second ties up cash, and your working capital sits in the items you need least.
The newsvendor's critical ratio
Operations research answers this with the newsvendor model. The stock level that maximizes expected profit is not the forecast. It is the point in the range of possible demand where the chance that demand stays at or below your stock equals the critical ratio: the cost of running short, divided by the cost of running short plus the cost of running over.
Take the bearing. A unit you cannot supply loses $40 of margin; a unit left over costs $10 to carry, discount or scrap. The ratio is 40 / (40 + 10) = 0.8, so you stock to the 80th percentile of demand, enough to cover it in four weeks out of five. The forecast puts next week's demand between 80 and 125 units in eight weeks out of ten, with 100 in the middle and the 80th percentile at 115. The target is 115 on hand, not the 110 your 10% rule gives: each unit up to that point earns more in expected margin than it risks in carrying cost. Each weekly order brings stock on hand and on order, less backorders, back up to 115; the ratio sets that target.
The gasket kit runs the other way. A shortage costs $5, because customers accept a short backorder, and a spare kit costs $15 in holding costs and obsolescence. Its ratio is 5 / 20 = 0.25, so with a middle of 40 you stock to the 25th percentile: 32 kits, where the 10% rule stocks 44. Two items, opposite decisions, and one number per item expresses neither.
Forecast a range for every item
Build the fix into the forecasting system, so it does three things for each item and location:
- Forecast a range, not a point. Percentiles of demand, at whatever point each item needs.
- Store each item's two costs. Margin lost when short; cost to hold or clear when over.
- Order to the item's own percentile. Its critical ratio picks the point in its range.
Models that return percentiles directly are well established; they train on your sales history, with seasonality, promotions and lead times. Record the days each item was out of stock and estimate the sales lost on them, so the model learns demand, not only what the shelf allowed. Finance supplies the costs: gross margin, a carrying-cost rate and an obsolescence rate per category. Recompute it all every week, as the latest sales and returns come in.
Send the wide ranges to a planner
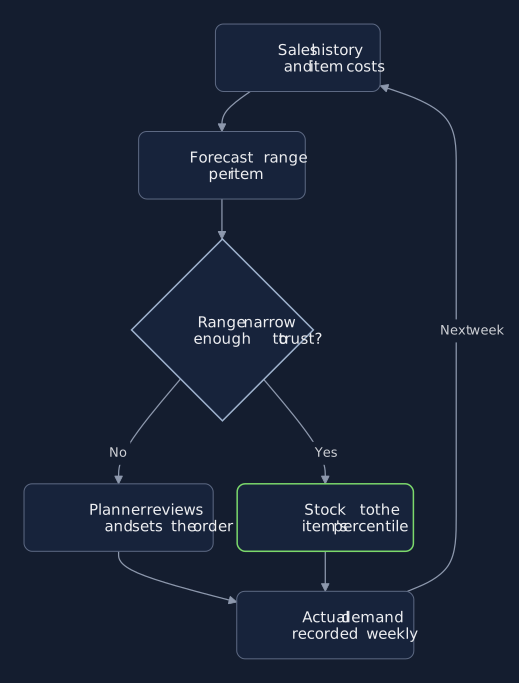
Some ranges are too wide to act on: a product launched six weeks ago can show a range from 5 to 90 units around a middle of 30, and stocking its 80th percentile ties up cash on a guess. Start with a simple flag: when an item's order is above a dollar threshold your finance team sets, and either its gap between the 10th and 90th percentiles exceeds the middle estimate or demand recently landed outside its range more often than the range claimed, the item goes to a planner with its range and history. The bearing, with a gap of 45 around 100 and demand landing where its range said, orders automatically each week.
Your planners stop adjusting thousands of numbers by feel and review only the items where judgment adds something. Each week's actual demand feeds the next forecast.
Check the range against reality
A range is only useful if demand lands inside it as often as it claims. Each week, check: across items stocked to the 80th percentile, demand should land at or below the stock in about 80% of cases. At 65%, those forecasts run low and you run short more often than you priced; at 95%, they run high and you hold cash you did not need to. Check it by item family.
For a client in property technology, we built a valuation engine on the same principle. It returns each price with a calibrated confidence band, lands within 10% of the closing price for 90% of cases in dense metro areas, and routes the estimates it cannot stand behind to a human appraiser. The band and the routing rule let every other estimate run without review.
When a single number is enough
Items with steady demand and similar costs on both sides gain little: their range is narrow and their ratio sits near 0.5, so the middle estimate is already close to right. The gain sits where costs are lopsided or demand arrives in irregular bursts; look there first.
Three steps to take first
- Pick three item families. One runs short, one piles up, one in between.
- Price both costs for each. Margin lost if short; cost to hold if over.
- Compute each family's ratio. Check it against last year's shortfalls.
Bring your item costs to a call
A fifteen-minute call takes your three item families and their costs of running short and over, and shows the percentile each should be stocked to, and what sales history turns that into a stock level. If your current rule already lands close, you hear that plainly and keep it.
Where a forecast must become a range, Engineering builds the percentile forecasts, cost table and planner queue with your team, so your planners own and run them.
References
- Retail Insight Network. How overstock, stockouts, and returns cost retail $1.75tn. Retail Insight Network, published 2026-08-06.
- US Census Bureau. Manufacturing and Trade Inventories and Sales, August 2026. US Census Bureau, published 2026-10-15.