Model accuracy is not a business result. It is a property of a model measured against a dataset, and no budget owner can spend one. A system can clear every target on its model card and change nothing in how a company operates: the predictions arrive too late, land in a tool nobody opens, or answer a question nobody was blocked on. A survey of 1,000 C-suite executives (BCG, 2024) found that 74% have yet to show tangible value from AI.
The fix is a measurement stack that follows value from what the system does to what the business decides. On the cloud ECG backend ML LABS designed and built for HeartSciences, the numbers that decided whether the platform worked were never a provider's accuracy figures. They were per-provider tail latency, retry rates by failure class, and the share of studies where two providers disagreed on a clinically actionable finding.

Four Levels Of AI Measurement
Measurement that survives a budget review moves through four levels: inputs describe what the system is fed, outputs what it produces, outcomes what people do differently because of it, and impact what the business banked, net of what the system costs to run. The bottom two come free with the infrastructure. The top two must be built deliberately, which is why a dashboard can be all green while the BCG finding holds for its owner.
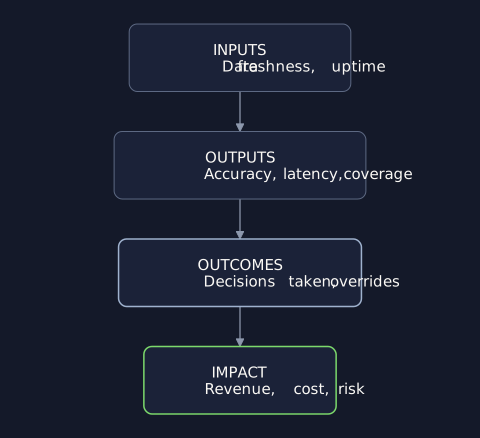
The outcome level decides the rest. Research on AI and human decision-making (HBR, 2021) found the primary determinant of AI value is whether the system changes decision-making behavior, which makes override rate the most diagnostic signal available, and the most misread. Research on algorithm aversion (Journal of Experimental Psychology, 2015) showed that people abandon a model faster than a human forecaster after identical errors, so a climbing override rate can be trust collapse rather than model degradation.
None of the four levels is legible without a baseline: current performance, the method used to measure it, and the variance range that separates an improvement from a good week.
Signals A Data Sheet Hides
The ECG platform's AI layer runs studies through multiple model providers, each with its own latency behavior, availability pattern and billing consequence. A provider's published accuracy is a laboratory claim about a model, not about the system a clinician touches. What decides clinical trust lives in the tail: the slowest requests, the malformed response, the retry that must never become a second billable result for the same study.
Each of those three signals changes an engineering decision. Tail latency is read per provider, because an average across providers hides the failing one. Retries are counted by failure class (network, malformed response, model error), since the three have different owners and fixes. Cross-provider disagreement on an actionable finding is the closest thing to a live accuracy signal a production system can have without a ground-truth label.
Aggregate accuracy is a claim about a model. Tail latency, retry rate by failure class, and cross-provider disagreement are claims about the system a clinician actually uses, and only the second kind can be acted on.
Not one of those is an accuracy number, and each names its decision: which provider to route to, which failure class to engineer against, which finding to escalate. That is the test for whether a metric belongs on the dashboard: name the decision it changes, or take it off.
Where Value Leaks Between Levels
Value does not leak inside a level. It leaks at the transitions, and each has a signature the dashboard should surface rather than bury in a level-internal average.
- The technical break. Throughput stays healthy while accuracy degrades, or a rising tail latency pushes the consumers of its output back to their defaults.
- The adoption break. Strong model accuracy, a flat action rate. When one cohort or class of prediction concentrates the overrides, the problem is workflow fit, not model quality.
- The attribution break. Decisions change and the business metric stays flat: the model is influencing the wrong decisions, or the right ones in volumes too small to show.
A naive before-and-after comparison cannot separate the model's effect from everything else that moved in the same window. Three approaches follow: a randomized holdout, difference-in-differences against a comparable metric the system does not touch, and an interrupted time series projected from the pre-deployment trend. Pick the method before deployment, because a method chosen after the results are in is chosen to fit them.
A fourth leak opens after the dashboard is built: nobody owns the measurement, and it quietly stops matching the system. On a hedge-fund engagement, told in full in the ownership argument for AI systems, polluted data accumulated unnoticed, an aggregation step was discarding information the models needed, and nothing in the client's own reporting surfaced either. Once someone whose job was to look actually looked, storage costs came down by more than 60% and the models then performed 2% better.
First Steps
- Name the decision each metric changes. Walk the AI dashboard line by line; every metric not tied to a decision someone would make differently comes off the dashboard.
- Find the capture point. Locate where a human acts on a prediction and instrument that act (adoption, override, action) before adding anything to the model layer.
- Write the attribution rule before the next deployment. Pick a method, then record the baseline and its variance range while the pre-AI state still exists.
The Bar For A Real Dashboard
The pattern is one metric per level on a single page. Inputs and outputs prove the system is alive, outcomes prove somebody changed what they did, and impact proves the company banked the result. The bar: every metric on the page names the decision it changes. The baseline predates the deployment and carries its variance range. The attribution method was chosen before the results existed. And one owner stays accountable for the numbers still meaning what they meant at launch, because thresholds calibrated at launch keep reporting green against a distribution that has moved out from under them. Where that stack has no accountable owner, Advisory puts a named owner on what ML LABS built: the practice that runs it holds the dashboard that says whether it is worth running. A program clearing all four lines of that bar is measuring its AI spend; one clearing two is reporting on it, and the gap between the two is the number the next budget review will ask for.
References
- Boston Consulting Group. Where's the Value in AI?. BCG, 2024.
- De Cremer, D., and Kasparov, G. AI Should Augment Human Intelligence, Not Replace It. Harvard Business Review, 2021.
- Dietvorst, B. J., Simmons, J. P., and Massey, C. Algorithm Aversion: People Erroneously Avoid Algorithms After Seeing Them Err. Journal of Experimental Psychology: General, 2015.